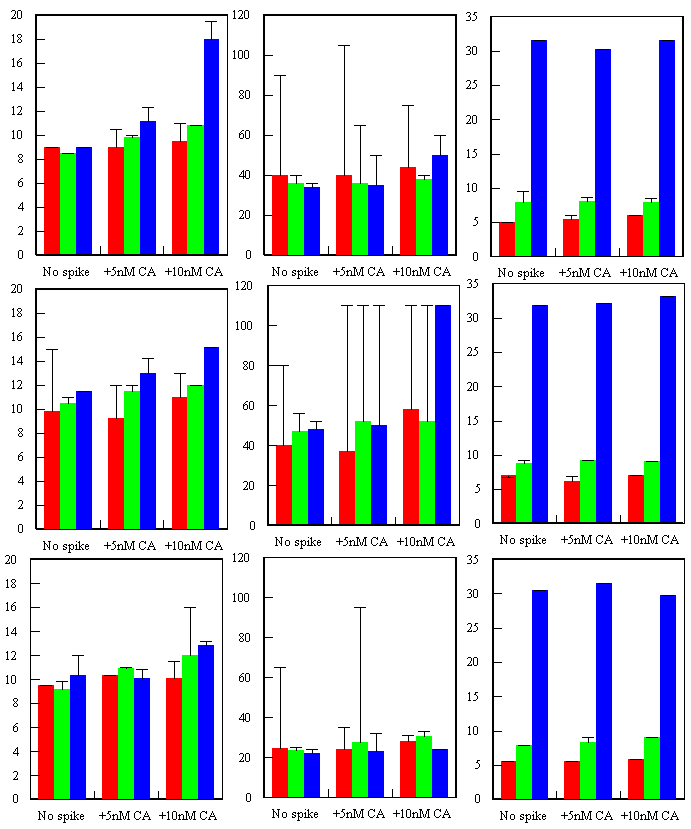
Top:
Garret screen sample, day of sampling, Middle: Garret screen sample, analysed next dayBottom: Subsurface sample, analysed next day
Red:
no DA added, Green +100nM DA, Blue +1000nM DALeft:
CA-DA peak 285/460nm, Middle:Tryptophan peak 285/340nm, Right: DA peak 325/520nmFluorimeter sensitivity 10. Error bars indicate range of rapid variation