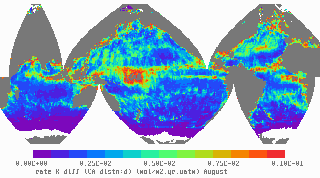
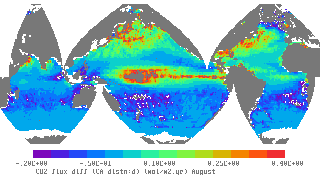
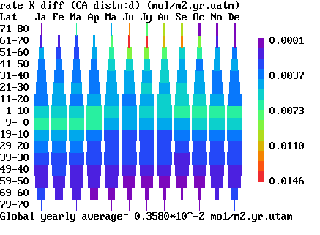
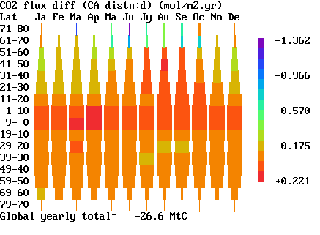
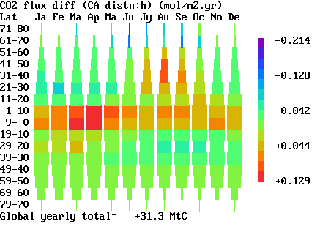
Figure 9-23: Catalysed transfer velocities and fluxes using the "low-cost" physiological distribution (plots kdd8, kdd, fdd8, fdd, fdh)
Top: Reaction-only transfer velocity (left) and CO2 flux (right) using "low cost" physiological distn .
August (top) and year summary (centre).
Bottom: CO2 flux with lower average enzyme concn.