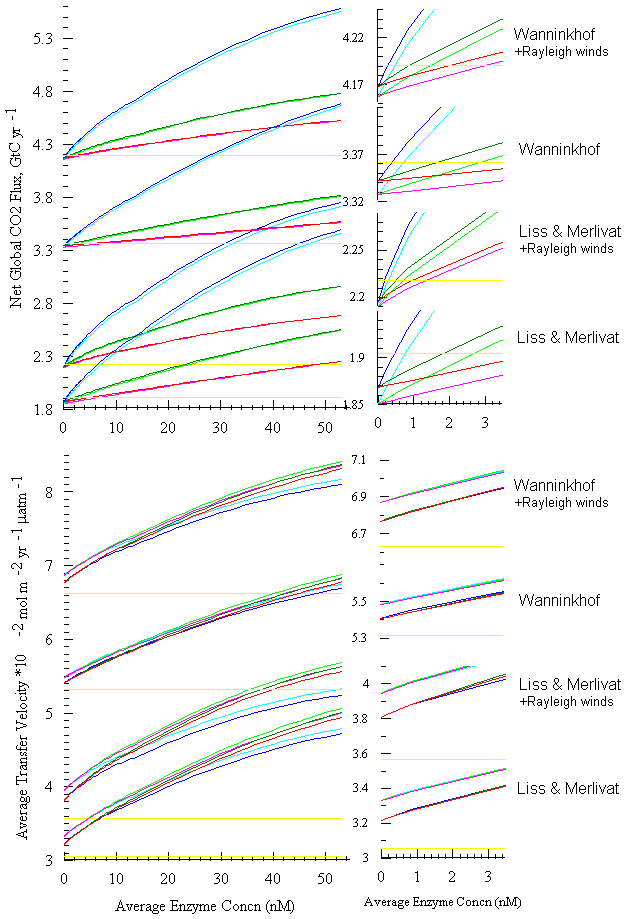
Calculated for 0, 0.21, 0.83, 3.3, 13.3 and 53.2 nM average enzyme concn. The smaller plots enlarge the origins.
Yellow = diffusion only, red = chlorophyll-only, dark-green = "low cost", blue = "high cost" physiology,
{magenta, light-green, cyan} = same as {red, dark-green, blue} with OH- reaction rate multiplied by six.
