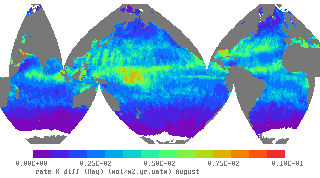
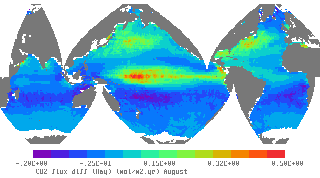
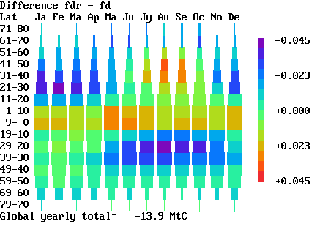
Top: Transfer velocity due to reaction only, using Rayleigh windspeeds (left), and CO2 flux (right) for August
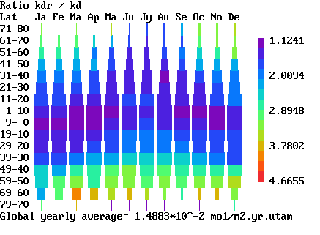
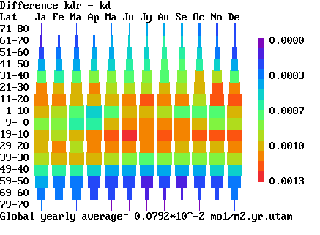
Middle: Ratio (left) and difference (right) of reaction-only transfer velocities with and without Rayleigh windspeeds
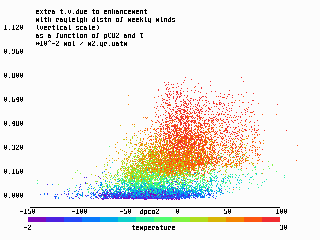
Bottom: Difference of reaction-only fluxes (left), and scatterplot of reaction-only transfer velocities as a function of D pCO2 and temperature (right)
 |
 |
 |
 |
 |
 |