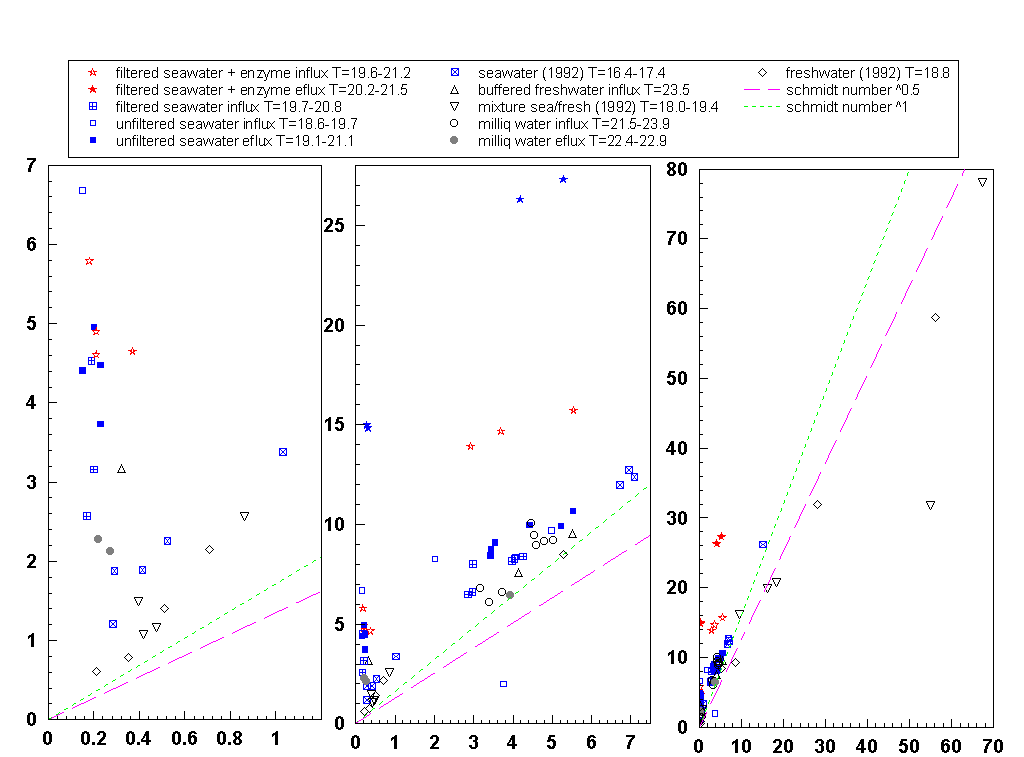
CO2 transfer (vertical axis, cm hr-1) is plotted as a function of SF6 transfer velocity (horizontal axis, cm hr-1). The three graph scales emphasise different parts of the same dataset. The lower of the two lines corresponds to Sc-0.5, and the upper to Sc-1.
